Understand your entire application with the Radius Application Graph
In today’s complex landscape of cloud-native architectures, it can be difficult to understand how all the pieces of an application fit together. With the advent of containers, microservices, serverless, and Kubernetes, applications are becoming more flexible yet resilient than ever before, but at the cost of increased complexity. As a result, developers and operators struggle to understand how their applications are structured and how their resources are connected. In this blog post, we’ll discuss the challenges of understanding cloud-native applications and how the Radius Application Graph can help. We are very excited about the potential of the Application Graph and are looking forward to building upon it with the community!
Complicated cloud-native architectures are challenging to manage
A single application can be composed of multiple microservices, each with their own resources, dependencies, and relationships. Typically defined in lists of Kubernetes YAML, infrastructure-as-code templates, and Helm charts, the seemingly straightforward question of “what is my app?” becomes difficult to answer. Moreover, there is no standard when it comes to describing the relationships and dependencies between resources. Instead, teams are left to recreate their architecture with network-packet diagrams, or with team wikis documented separately from the application, all of which quickly fall out of date.
Applications are so much more than just Kubernetes
While Kubernetes has become the go-to platform for teams building cloud-native apps, an application is so much more than a flat list of Kubernetes resources. What’s needed is a way to model an entire application and its relationships, consisting of both its Kubernetes components plus external cloud or on-premises infrastructure, presented in a way that’s always up to date and easy to consume.
Gaps in knowledge hinder cross-team collaboration
Today’s enterprise software developers work on large-scale applications, often with microservice architectures that span across different teams, which means they might become exposed to only a fragment of the overall application in their day-to-day work. This makes onboarding to and learning new codebases very difficult as developers are having to piece together bits of knowledge from different team members. Even worse, in the event of a high-severity incident, the business impact becomes significant as developers spend extra cycles to find the root cause of the issue when they don’t have a comprehensive picture of how the application is put together. Similarly, IT operators have to parse through lists of resources in their various AWS, Azure, etc. consoles to try make sense of the application and dependencies that have been built by the developers. There is never a comprehensive and up-to-date view available that shows how all the many components are related. Ultimately, it becomes impossible for them to completely understand how all the infrastructure is used within their organization, let alone effectively manage it to enforce policies and best practices.
Documentation is tedious to maintain and frequently outdated
Traditionally a manual task, documentation is labor intensive, inconsistent, or outright missing, and may be frequently outdated despite best intentions. After all, there’s no guarantee that everyone in the organization operates at the same level of detail and diligence required to maintain sufficient documentation. A manual process is not only time-consuming for developers and operators, but also error-prone and difficult to enforce standards. Given the fast pace of change in modern systems and businesses, manual documentation has become a bottleneck to development velocity. Being tangential to the development process at best, it’s no wonder that documentation is often the first thing to be neglected when teams are under pressure to deliver.
Introducing the Radius Application Graph
The Application Graph is a core primitive of Radius Applications and provides a comprehensive representation of an application and its resources, including its environments and connections. It is a graph-like data set that reveals precisely how the resources within the application are interconnected. This data is generated automatically as part of the development process with Radius inherent in the application declarations, so it is always up to date without requiring additional effort from developers. Below we’ll explore how the application graph data is generated, as well as how it can be accessed and leveraged.
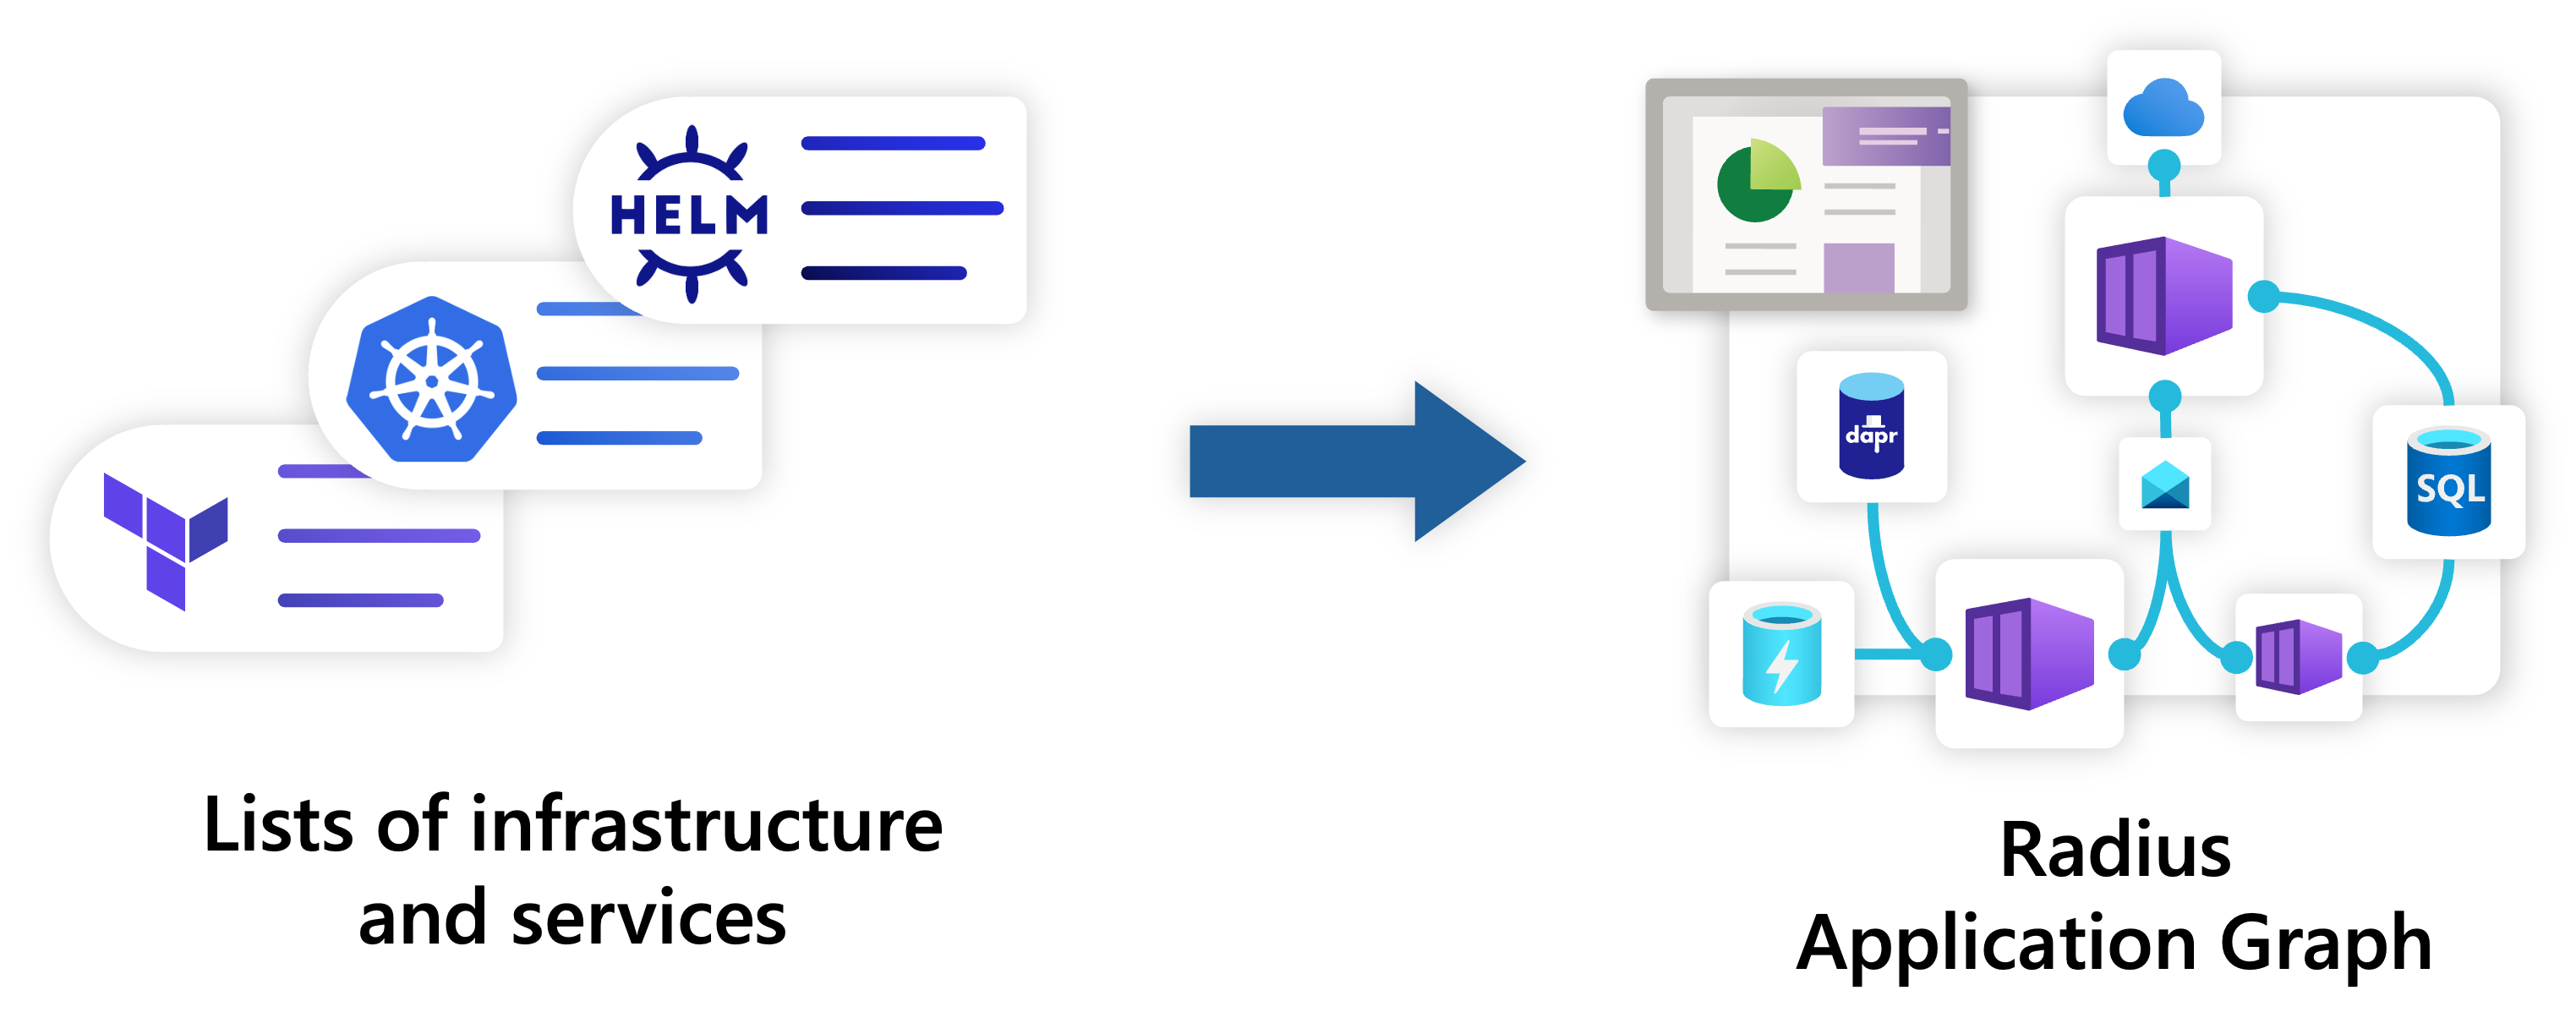
Application graph data that is inherently part of the development process
With an application structure that includes environments, resource definitions, and connections, applications deployed using Radius get represented into a graph-like data set that reveals precisely how the resources within the application are interconnected. When developers declare a connection between two resources, Radius injects resource related information into environment variables that are then used to access the respective resource without having to hard code URIs, connection strings, access keys, or anything that application code needs to successfully communicate. By leveraging Radius to simplify the provisioning, deployment, and connecting of resources, the application becomes self-describing. Best of all, this data is generated automatically as part of the Radius application development process, so it is always up to date without requiring additional effort from developers.
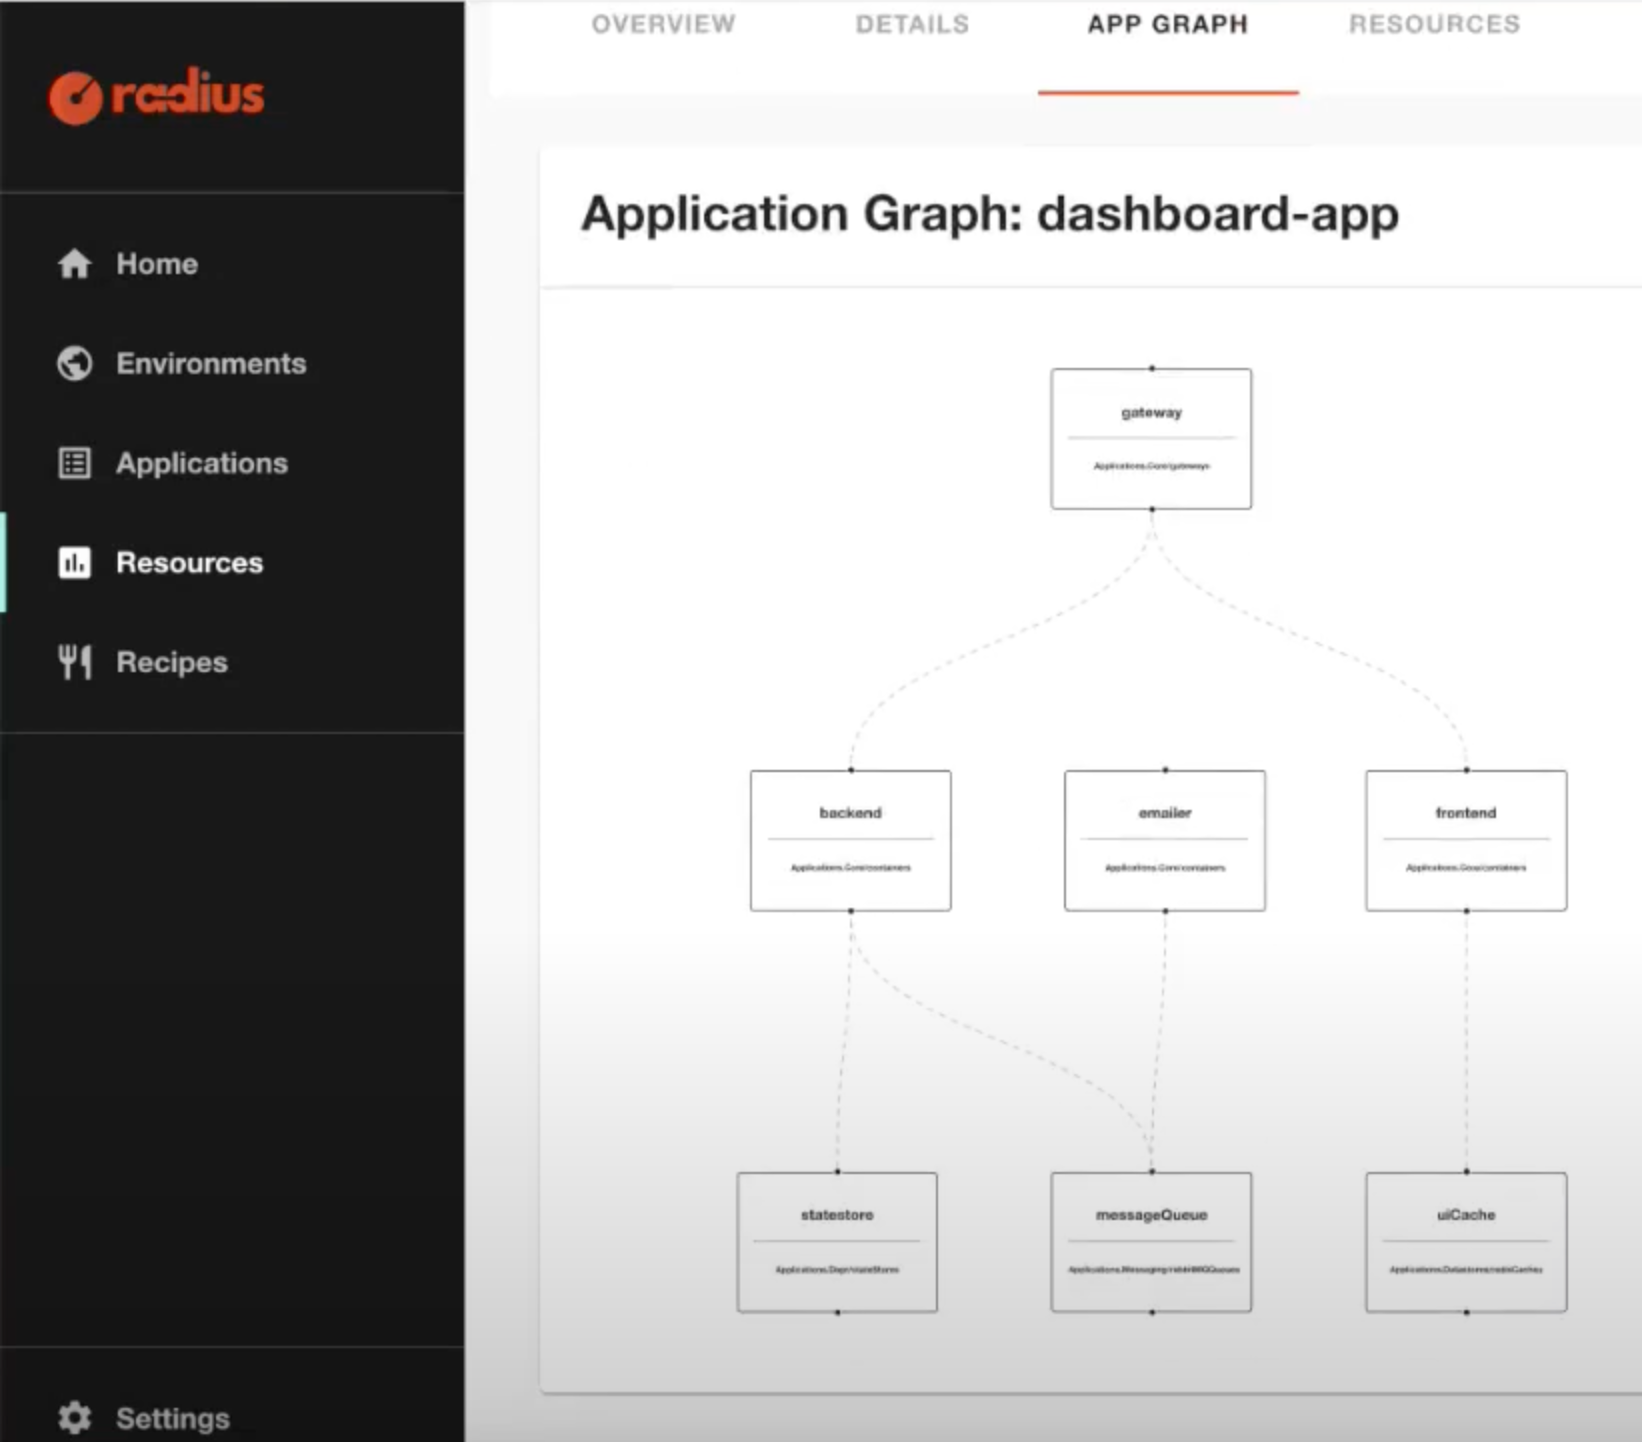
Visualize the application graph on the Radius Dashboard
During a recent community meeting, a preview of the Radius Dashboard prototype was shared. Serving as the frontend experience for Radius, the Dashboard provides a visualization of the application graph data, providing both textual and visual representations of the Radius Applications and resources, as well as a directory of Recipes that are available to the user. Work is currently underway to package Dashboard into future releases as a ready-to-use Radius feature. In the meantime, you may visit the Dashboard repo to try it out today as a prototype feature. The Radius Dashboard is in its early days and maintainers are looking forward to working with the community to grow its feature set. If you are interested in contributing to the Dashboard, please visit the issues board. Items tagged with good first issue are a great place to start for new contributors.
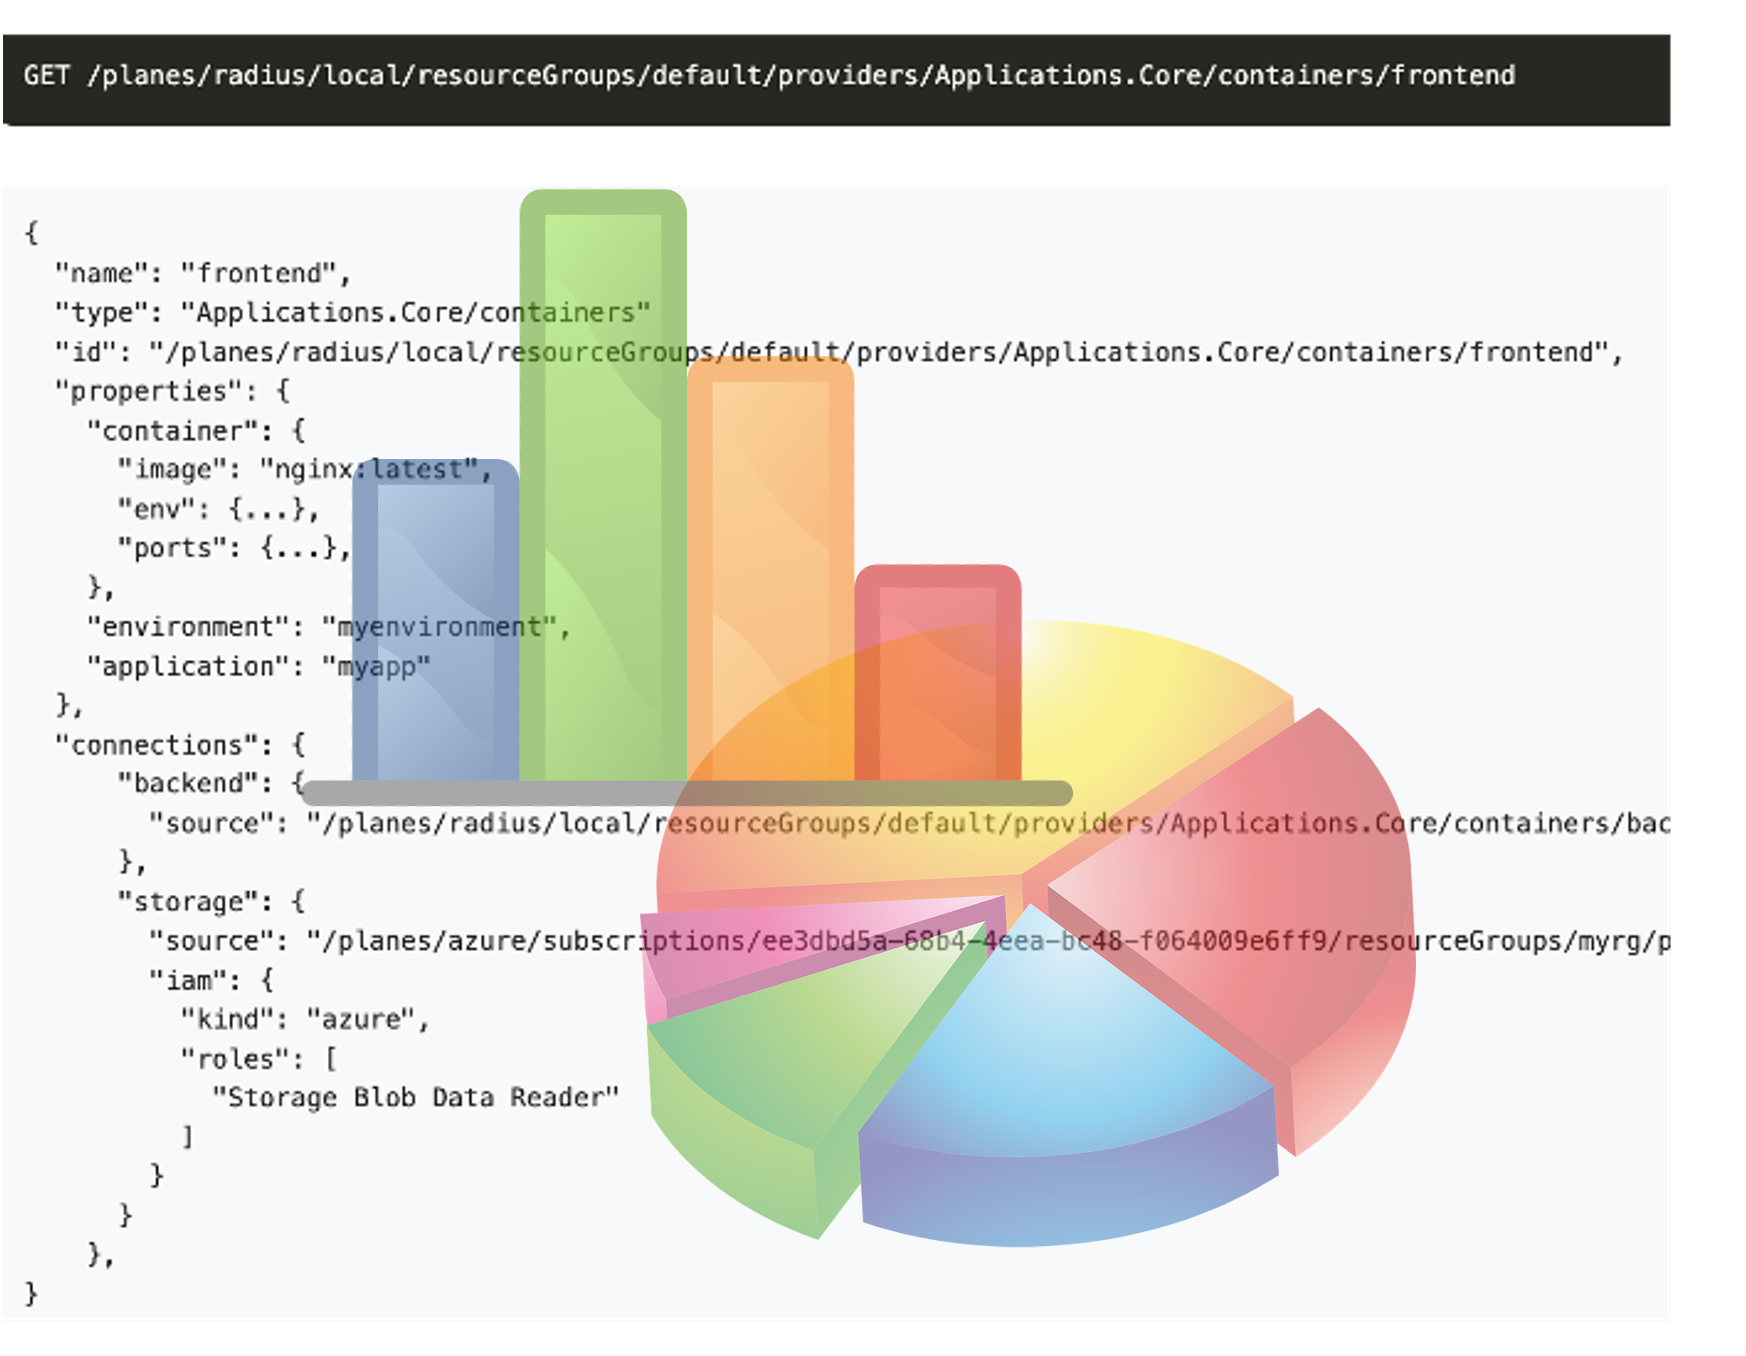
Mine the Application Graph data using the Radius API
Instead of needing multiple views for Kubernetes and cloud resources, Radius provides a single source of truth for the application. The application graph API provides a way to query the application graph data, empowering operators and developers to mine the data for insights or even build additional visualizations to suit their needs. Radius provides an HTTP-based API that allow users to communicate with its control plane to query for the application graph data. The API can be hosted inside a Kubernetes cluster or as a standalone set of processes or containers. Visit the Radius API documentation pages to learn more.
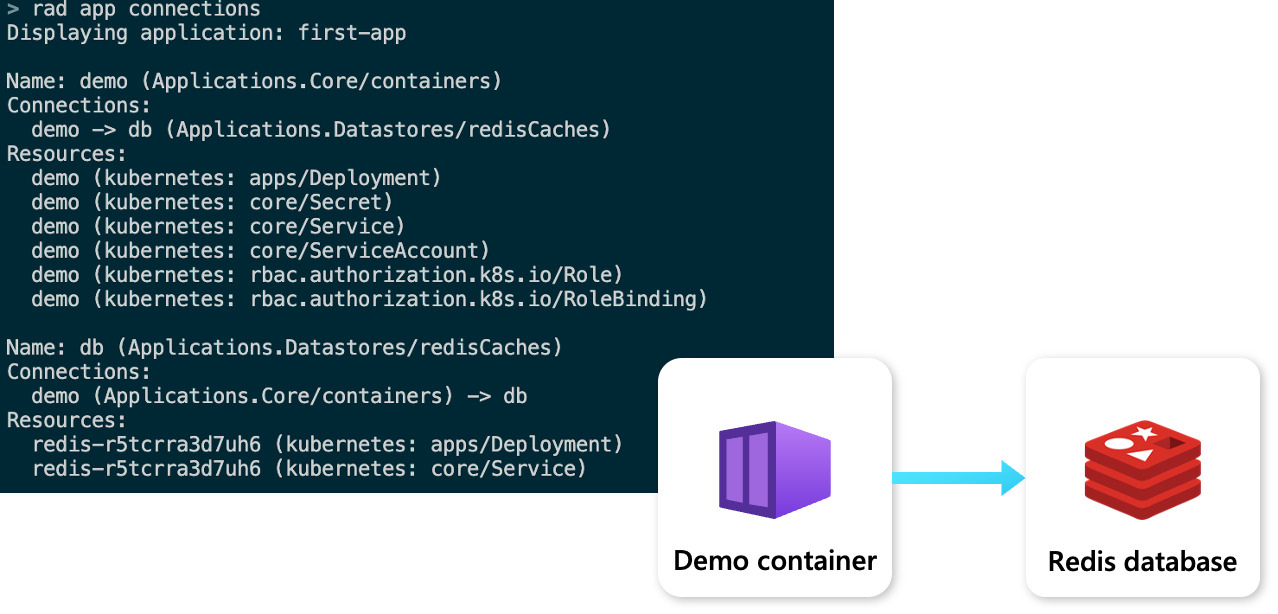
View application graph relationships using the Radius CLI
The Radius CLI provides a lightweight rad app graph command to view the application graph with its resources and connections in a terminal window. This provides developers and operators with a way to quickly understand how the application is structured and how its resources are connected in real-time while they are building their applications.
Learn more and contribute
The Radius maintainers are excited to continue collaborating with the open-source community to grow its feature set and welcome all contributions from the community.
We’re looking for people to join us! To get started with Radius today, please see:
- Learn more from the documentation.
- Explore the open-source code repositories.
- Engage with the community.