Day One in an Unknown Repo
On your first day on a new team, you clone the application repository and find twelve folders
under src/ written in five languages, next to Kubernetes manifests, a Helm chart,
Kustomize overlays, and a Terraform directory. Before you can fix a bug or add a feature,
you need to know what the application is made of. Which folders are services? What does
each one talk to? Which databases, caches, and queues are involved, and who depends on
whom?
The answers are in the Dockerfiles, Kubernetes manifests, Helm charts, configuration, and source code, with each file describing part of the application. The application graph brings that information together in a single view, so you can get the overall idea of the application at a glance and then go to the files for the details.
The repository in this example is Online Boutique, a sample e-commerce application where visitors browse products, add them to a cart, and check out. Its default deployment runs ten services written in Go, C#, Node.js, Python, and Java, plus a Redis cache for shopping carts. With a front end, a layer of business services, and a data store, it is a good example of a multi-tier application, and it is the one we will use throughout this post.
About this series
This post is the first in a series about Radius Canvas for the GitHub Copilot app. Radius Canvas gives you an application graph: a visualization of your application’s workloads, the resources they depend on, and the connections between them, drawn from an application model that lives in your repository.
Each post in the series follows a developer through one stage of working with an application: getting to know it, reviewing AI generated changes, and taking it all the way to the cloud. We are starting at the beginning, with day one in an unknown repository: discovering the application, generating an application model, and understanding its architecture before writing a single line of code.
Generating the application model
Install the Radius plugin in the GitHub Copilot app by opening Customize, selecting Plugins, and searching for radius. Then open the repository and ask Copilot
Show me the application graph.
Radius analyzes the repository and infers the application’s structure: its workloads,
the resources they depend on, the connections between them, and the infrastructure the
application needs. It writes that understanding to an application definition in
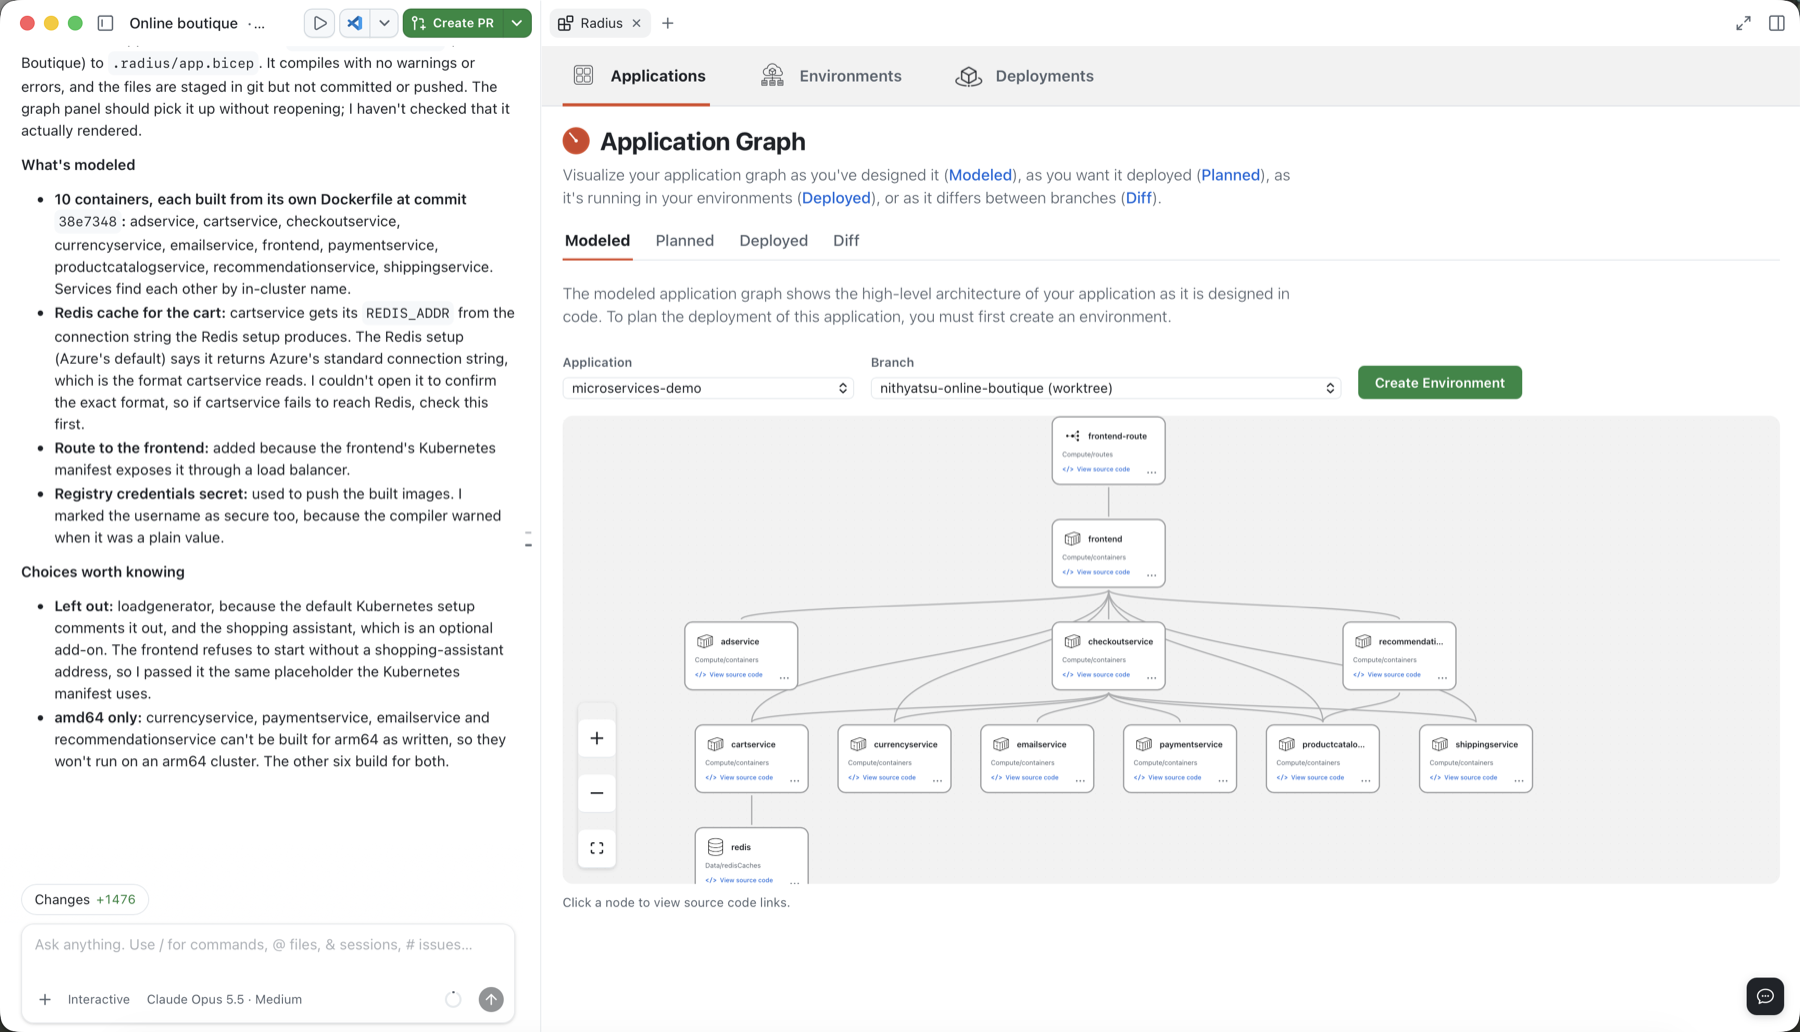
.radius/app.bicep, and Radius Canvas opens with the Application graph, a rendering
of that file.
The definition is a regular file in your repository. You can read it, adjust anything Radius got wrong, commit it, and share it with your team. Instead of every developer (or every AI agent) rebuilding an understanding of the application from scratch, there is now one model everyone can start from.
Understanding the application
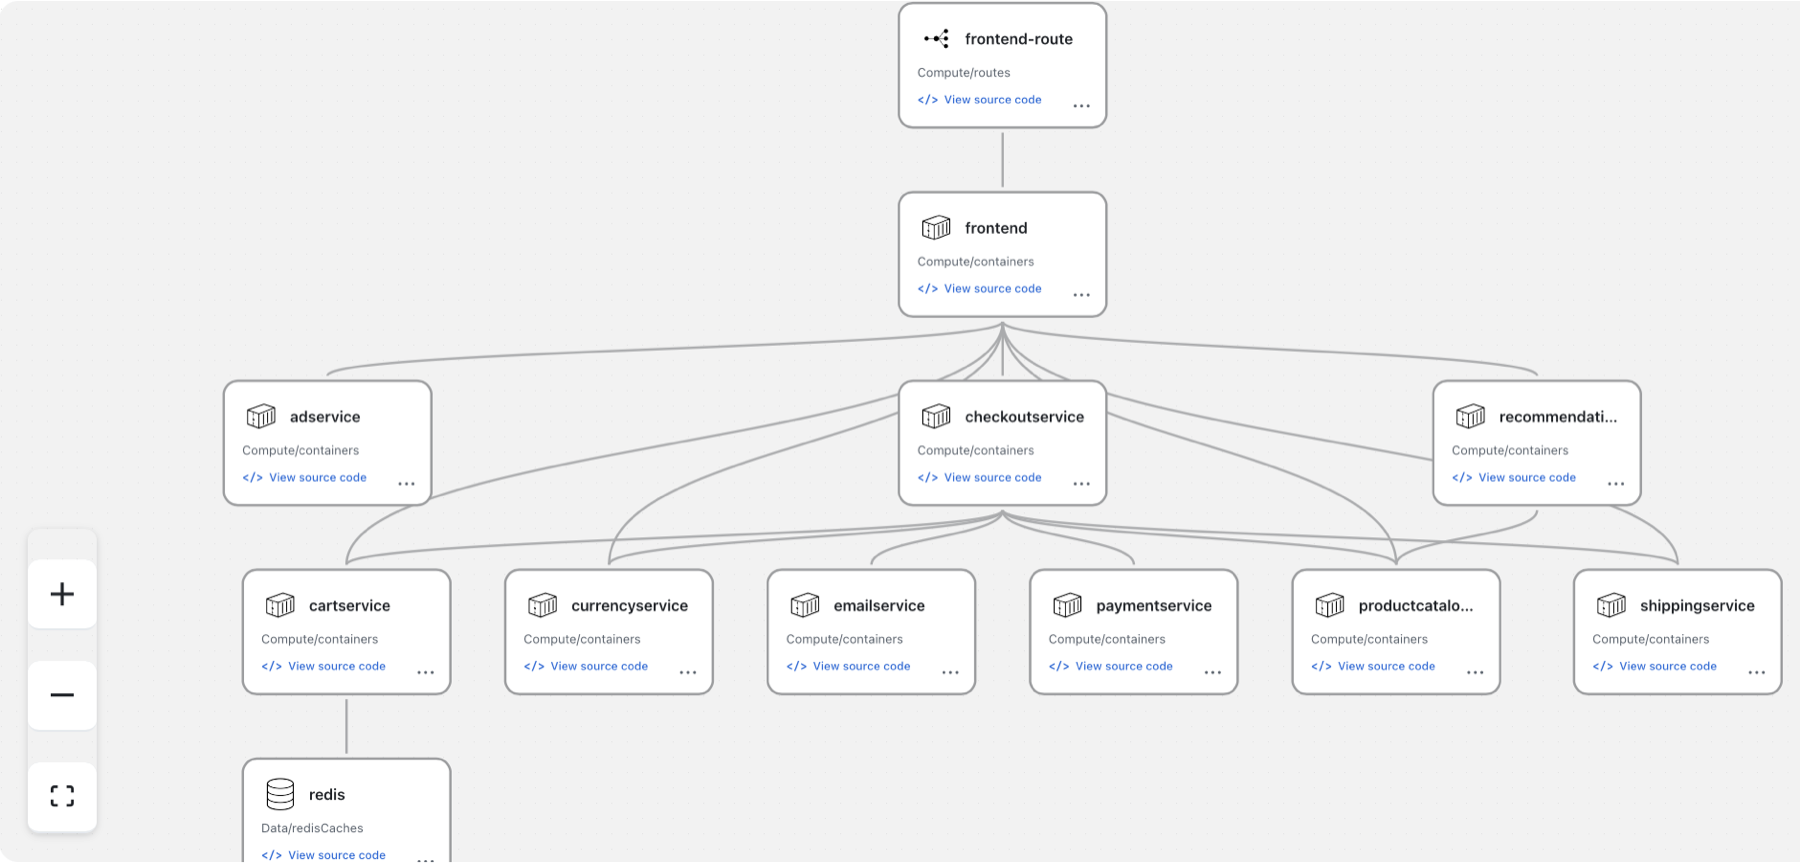
The application graph is an architectural starting point for understanding the application. It shows the workloads, dependencies, and connections that Radius inferred from the repository.
A few things to look for the first time you open it:
- Workloads. Every service in the application, whether it is a front end, an API, or a background worker.
- Dependencies. The databases, caches, message queues, and other resources each workload relies on.
- Connections. Which workload talks to which, and which resources they share. This is often where the surprises are: a service that bridges two halves of the application, or a resource that more services depend on than you expected.
For Online Boutique, the graph has four levels:
- Entry point.
frontend-routeexposes the application, and it connects only tofrontend. - Front end.
frontend, the Go web server, connects to seven of the other nine services. - Business services.
checkoutserviceconnects to six services: cart, currency, email, payment, product catalog, and shipping.adserviceandrecommendationservicesit beside it and are called by the front end. - Data.
redisis the only data store in the application, and onlycartserviceuses it. The other services keep no state of their own.
Two things are easier to see in the graph than in the files. First, checkoutservice
is where a single order touches most of the application, so a problem in any of its six
dependencies shows up at checkout. Second, emailservice and paymentservice are
only reached through checkoutservice, so you will not find them by reading the front
end.
From the application graph to source code
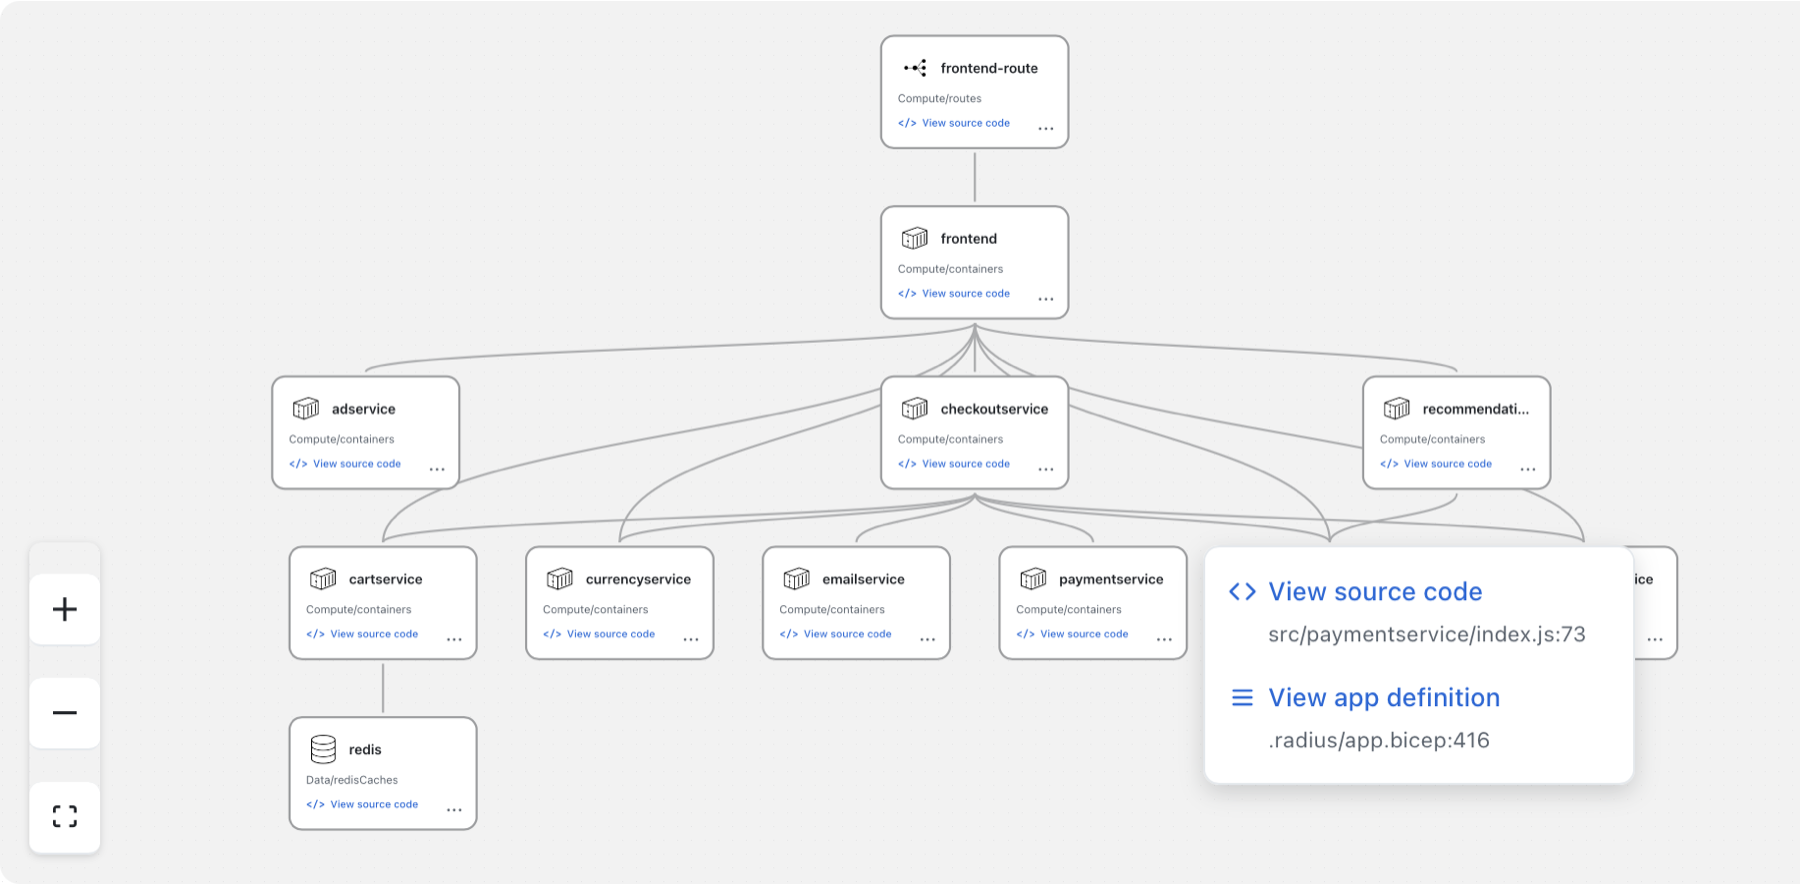
Each node in the graph includes a reference to the source code it was inferred from. Selecting a node opens the file and lines where that workload or connection is defined.
Each node has two links: View source code, which opens the code the node was
inferred from, and View app definition, which opens the matching resource in
.radius/app.bicep.
For checkoutservice, the source code link opens src/checkoutservice/main.go. A few
lines below it, the service reads the address of each service it calls:
mustMapEnv(&svc.shippingSvcAddr, "SHIPPING_SERVICE_ADDR")
mustMapEnv(&svc.productCatalogSvcAddr, "PRODUCT_CATALOG_SERVICE_ADDR")
mustMapEnv(&svc.cartSvcAddr, "CART_SERVICE_ADDR")
mustMapEnv(&svc.currencySvcAddr, "CURRENCY_SERVICE_ADDR")
mustMapEnv(&svc.emailSvcAddr, "EMAIL_SERVICE_ADDR")
mustMapEnv(&svc.paymentSvcAddr, "PAYMENT_SERVICE_ADDR")
These six environment variables are the six connections the graph shows for
checkoutservice. In .radius/app.bicep, each one is set from the service it points
to, which is how Radius records the connection.
Everything in the graph comes from the repository, so you could find the same information by reading the files. The graph collects it in one view and links each part back to its source.
A few things to keep in mind
The graph is only as current as the definition. Because the picture is drawn from
.radius/app.bicep, keeping it accurate means keeping that file up to date. The nice
part is that this is the same file you change when you add a cache or a queue to the
application, so updating the diagram becomes part of making the change rather than a
separate chore.
The preview has a focused scope. Today Radius Canvas works with containerized applications that have a Dockerfile, one application per repository. You can see what is planned next on the Radius Canvas roadmap.
See it in action
If you have a repository you have been meaning to get to know, give it a try and let us know how the graph looks. We would love to hear what works well and what doesn’t.
Up next
Now that you understand the application, it is time to start changing it. These days, many of those changes are written with the help of AI, and they can touch a lot of the application at once. In the next post, we will look at how the application graph helps you review AI-generated changes and see what they mean for your architecture. Stay tuned!
Learn More
- GitHub Copilot app integration in the Radius documentation
- Introducing Radius Canvas, the public preview announcement
- Radius Canvas in the GitHub Copilot app, a video walkthrough
- Radius Canvas roadmap, where you can vote on what comes next
- Join the discussion or ask for help on the Radius Discord server
- Subscribe to the Radius YouTube channel for more demos